Prometheus Node Exporter is a powerful tool used to monitor hardware and OS-level metrics such as CPU usage, memory consumption, disk space, and more. It’s lightweight, efficient, and essential for setting up a robust monitoring stack using Prometheus.
In this detailed guide, we’ll walk you through the process of installing and configuring Prometheus Node Exporter on an Ubuntu server.
Prerequisites
Before getting started, ensure the following:
- You have a running Ubuntu server.
- You have
sudoor root privileges on the server. - A basic understanding of Linux commands.
Step 1: Update and Upgrade the System
Before installing any new software, it’s best to update and upgrade your existing packages to ensure compatibility.
sudo apt update && sudo apt upgrade -y
This ensures your system is ready for new installations.
Step 2: Create a Dedicated User for Node Exporter
For security purposes, Node Exporter should not run as the root user. We’ll create a dedicated user with no shell access:
sudo useradd -rs /bin/false node_exporter
his creates a system user named node_exporter with restricted permissions.
Step 3: Download Node Exporter
Visit the Node Exporter GitHub releases page to get the latest version. For this tutorial, we’ll use v1.8.2.
wget https://github.com/prometheus/node_exporter/releases/download/v1.8.2/node_exporter-1.8.2.linux-amd64.tar.gz
Step 4: Extract the Node Exporter Binary
Once the tarball is downloaded, extract its contents:
tar xvf node_exporter-1.8.2.linux-amd64.tar.gz
Move the node_exporter binary to /usr/local/bin/ for global access:
sudo mv node_exporter-1.8.2.linux-amd64/node_exporter /usr/local/bin/
Clean up the unnecessary files:
rm -rf node_exporter-1.8.2.linux-amd64*
Step 5: Create a Systemd Service
To run Node Exporter as a service, create a systemd configuration file:
sudo nano /etc/systemd/system/node_exporter.service
Add the following content:
[Unit]
Description=Prometheus Node Exporter
After=network.target

[Service]
User=node_exporter
Group=node_exporter
Type=simple
ExecStart=/usr/local/bin/node_exporter

[Install]
WantedBy=multi-user.target
Save the file and exit (Ctrl + O, Enter, Ctrl + X).
Step 6: Start and Enable the Node Exporter Service
Reload the systemd daemon to recognize the new service:
Start the Node Exporter service:
Enable the service to start on boot:
sudo systemctl daemon-reload
sudo systemctl start node_exporter
sudo systemctl enable node_exporter
Step 7: Verify Node Exporter Installation
Check the status of the Node Exporter service to ensure it’s running:
sudo systemctl status node_exporter
You should see an “Active: running” message in the output.
Step 8: Confirm Metrics are Accessible
Node Exporter exposes metrics on port 9100. Use curl to verify:
curl http://localhost:9100/metrics
You’ll see a list of metrics that look similar to this:
# HELP node_cpu_seconds_total Seconds the CPUs spent in each mode.
# TYPE node_cpu_seconds_total counter
node_cpu_seconds_total{cpu="0",mode="idle"} 10369.35
node_cpu_seconds_total{cpu="0",mode="system"} 13.2
node_cpu_seconds_total{cpu="0",mode="user"} 26.43
...
Step 9: Open Firewall Port
If you want to access Node Exporter metrics remotely, ensure that port 9100 is open:
sudo ufw allow 9100
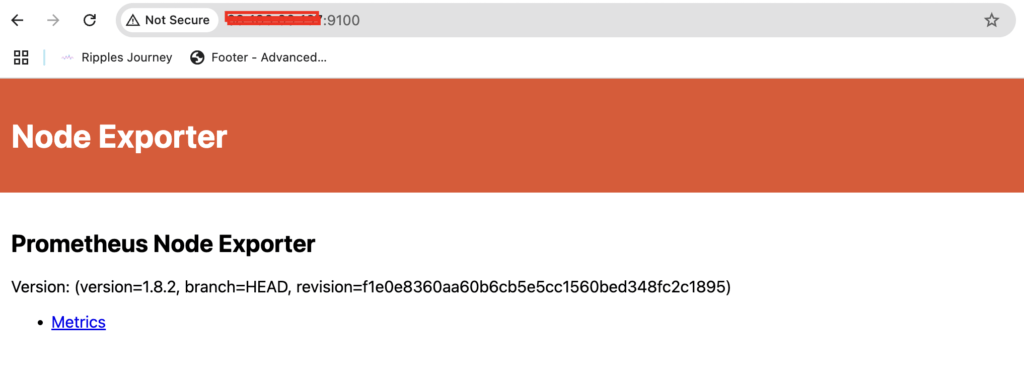
sudo ufw reloadhttp://<your-server-ip>:9100
Visit on your browser at port number 9100

Step 10: Integrate with Prometheus
To monitor the metrics exposed by Node Exporter, add it to your Prometheus configuration file (prometheus.yml).
Edit the Prometheus configuration file:
sudo nano /etc/prometheus/prometheus.yml
Add the following scrape configuration under scrape_configs:
scrape_configs:
  #Prometheus Job here


  #Node Exporter
  - job_name: 'node_exporter'
    static_configs:
      - targets: ['<your_server_ip>:9100']
Replace <your_server_ip> with the IP address of your Ubuntu server.
Reload Prometheus to apply the changes:
sudo systemctl restart prometheus
Step 11: Monitor Metrics in Prometheus
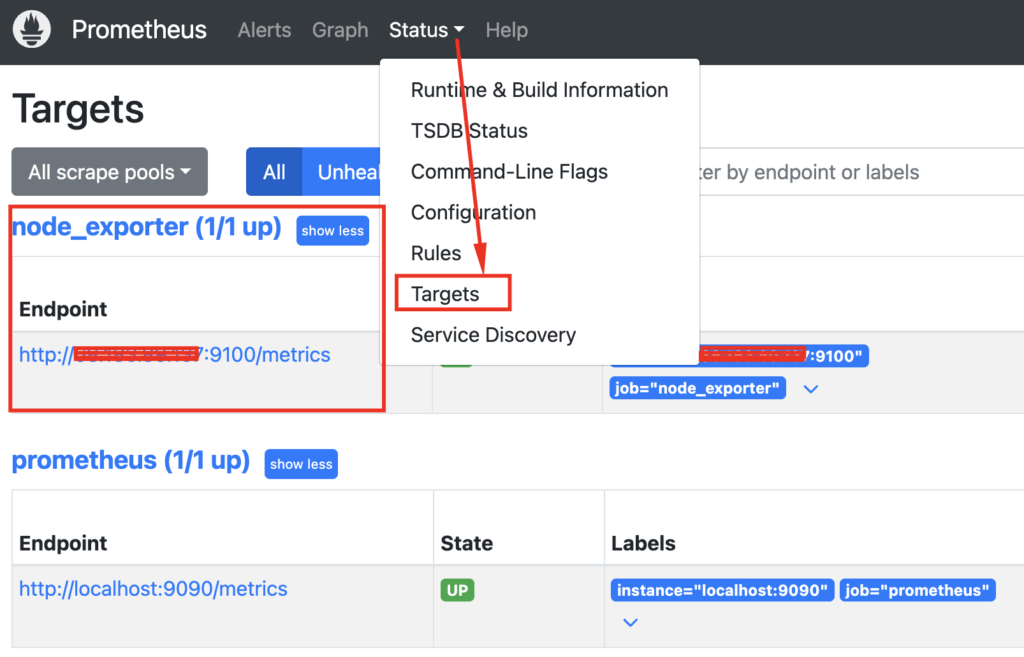
Visit your Prometheus web interface (usually http://<prometheus_server_ip>:9090). Go to the “Targets” page (Status > Targets) to verify that the Node Exporter target is active and being scraped.

Conclusion
You’ve successfully installed and configured Prometheus Node Exporter on Ubuntu. It is now exposing system metrics that Prometheus can scrape and monitor. With these metrics, you can create dashboards in tools like Grafana for detailed monitoring and alerting.
By following these steps, you can ensure a robust setup for monitoring the health of your servers. Node Exporter, combined with Prometheus, is an indispensable part of any modern monitoring stack.