Prometheus is a powerful open-source monitoring and alerting toolkit designed for reliability and scalability, particularly for time-series data. In this step-by-step guide, we’ll walk you through the process of setting up Prometheus on a DigitalOcean Droplet, allowing you to monitor your applications and infrastructure with ease. By the end of this tutorial, you’ll have a fully functional Prometheus monitoring system that helps you track metrics and visualize data.
Prerequisites
Before diving into the setup, ensure you have the following:
- A DigitalOcean Droplet (Ubuntu 20.04 or later recommended).
- A non-root user with
sudoprivileges. - SSH access to your Droplet.
- Basic familiarity with Linux commands and system administration.
Step 1: Update the Server
First, we need to make sure that your system is up-to-date. Log in to your DigitalOcean Droplet via SSH and run the following commands:
sudo apt update && sudo apt upgrade -y
This ensures that you have the latest security patches and updates installed.
Step 2: Create a Prometheus User (Optional but Recommended)
For security reasons, it’s best to run Prometheus under its own dedicated user. We will create a prometheus user and group for this purpose.
sudo useradd --no-create-home --shell /bin/false prometheus
sudo mkdir /etc/prometheus
sudo mkdir /var/lib/prometheus
Here, we’ve created a user prometheus without shell access and set up the necessary directories for Prometheus’ configuration and data storage.
Step 3: Install Prometheus
Now, we’ll download and install Prometheus on your Droplet.
Download Prometheus: Go to the Prometheus download page and grab the link for the latest release of Prometheus for Linux. Alternatively, you can use wget to download it directly:
wget https://github.com/prometheus/prometheus/releases/download/v<version>/prometheus-<version>.linux-amd64.tar.gz
<version> Add the version you want to install.
Here on my case I will download LTS Release (ie Version 2.53.3) at the time of writing blog.
wget https://github.com/prometheus/prometheus/releases/download/v2.53.3/prometheus-2.53.3.linux-amd64.tar.gz
Extract the archive : Run the following command to extract the tarball:
tar xvf prometheus-2.53.3.linux-amd64.tar.gz
Navigate to the Extracted Directory : After extracting, a directory named prometheus-2.53.3.linux-amd64 will be created. Navigate into this directory:
cd prometheus-2.53.3.linux-amd64
Move Prometheus Files to Appropriate Locations : Now, move the binaries and configuration files to their proper locations:
# Move Prometheus and promtool binaries to /usr/local/bin
sudo mv prometheus /usr/local/bin/
sudo mv promtool /usr/local/bin/

# Move configuration and other files to /etc/prometheus
sudo mkdir -p /etc/prometheus
sudo mv consoles /etc/prometheus/
sudo mv console_libraries /etc/prometheus/
sudo mv prometheus.yml /etc/prometheus/
sudo mv LICENSE /etc/prometheus/
sudo mv NOTICE /etc/prometheus/
Step 4: Configure Prometheus
Prometheus’s default configuration file is located at /etc/prometheus/prometheus.yml. Edit it as needed:
sudo nano /etc/prometheus/prometheus.yml
For a basic setup, you can leave the default configuration, which scrapes metrics from the local machine.
Optional Modify or Add Targets: To add additional targets (e.g., other servers or services you want to monitor), edit the static_configs section. For example:
scrape_configs:
  - job_name: 'prometheus'
    static_configs:
      - targets: ['localhost:9090']  # Prometheus monitors itself

  - job_name: 'my_application'
    static_configs:
      - targets: ['<your-server-ip>:9092']  # Replace with your application's IP and port
Save and exit the file (Ctrl+O, then Ctrl+X).
Step 5: Set Permissions
Now, you should change the ownership of these directories to the prometheus user and group to allow Prometheus to access and manage these directories securely. Run the following commands:
# Change ownership to the prometheus user and group
sudo chown prometheus:prometheus /etc/prometheus
sudo chown prometheus:prometheus /var/lib/prometheus

# Set appropriate directory permissions
sudo chmod 755 /etc/prometheus
sudo chmod 755 /var/lib/prometheus
Step 6: Create a Systemd Service
To manage Prometheus with systemctl, create a service file:
sudo nano /etc/systemd/system/prometheus.service
Add the following content:
[Unit]
Description=Prometheus Monitoring System
Wants=network-online.target
After=network-online.target

[Service]
User=prometheus
Group=prometheus
Type=simple
ExecStart=/usr/local/bin/prometheus \
    --config.file=/etc/prometheus/prometheus.yml \
    --storage.tsdb.path=/var/lib/prometheus \
    --web.console.templates=/etc/prometheus/consoles \
    --web.console.libraries=/etc/prometheus/console_libraries

[Install]
WantedBy=multi-user.target
Save and close the file.
Step 7: Start and Enable Prometheus
Reload systemd, start Prometheus, and enable it to start on boot:
sudo systemctl daemon-reload
sudo systemctl start prometheus
sudo systemctl enable prometheus
Check the status to ensure Prometheus is running:
sudo systemctl status prometheus

Step 8: Access Prometheus
Prometheus runs on port 9090 by default. Open it in your browser using the server’s IP address:
http://<your-server-ip>:9090
Step 9: Configure a Firewall
Make sure that port 9090 is open in the firewall or security groups of your server. If you’re using a firewall like ufw, you can check and allow port 9090:
sudo ufw allow 9090/tcp
sudo ufw reload
Ensure that inbound traffic is allowed on port 9090.
Step 10: Verify Installation
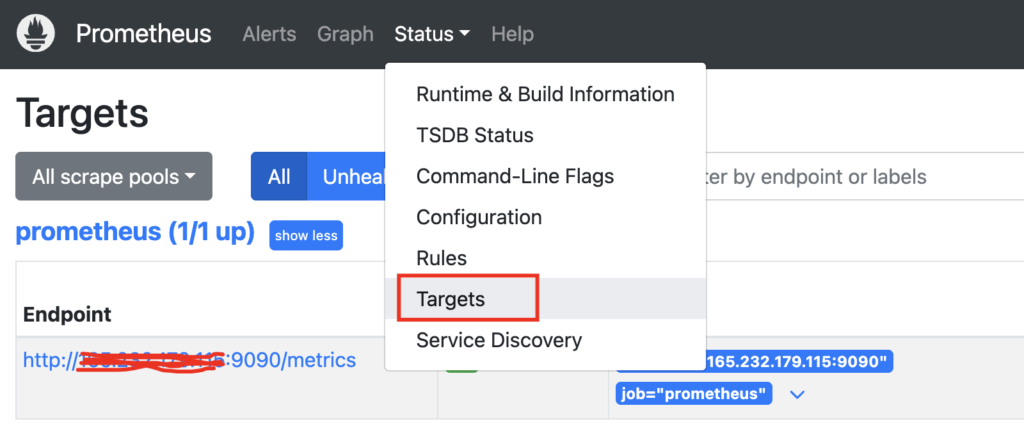
Navigate to the Targets page in Prometheus (Status > Targets) to ensure it is collecting metrics from the configured targets.

Conclusion
You’ve successfully installed Prometheus on your DigitalOcean server! From here, you can:
- Add more targets to monitor.
- Integrate Grafana for advanced visualization.
- Explore Prometheus’s query language (PromQL) for powerful data analysis.
By following these steps, you’ve set up a robust monitoring system to help keep your infrastructure healthy.